The gist for this lambda function can be found here.
The goal
It’s sometimes useful to be able to group a continuous variable into bins of equal counts such that we can work with that variable as it if were discrete.
In mathematics and machine learning applications, this process is sometimes referred to as “discretization”. If you’re an Excel user or statistician, you may know it as “binning”.
In short, we want to assign a group to each value in an array, such that the count of values in each group is equal, or as close to equal as possible.
A solution
This post will walk you through a lambda function called pd.qcut. It takes its name from the Python Pandas method of the same name. You can read about that method here.
While this lambda implementation is intended to be used in a similar way to the Pandas method, it is not identical.
=LAMBDA(x,q,[labels],[return],
  LET(
    _s,SEQUENCE(ROWS(x)),
    _x,SORT(CHOOSE({1,2},x,_s),1,1),
    _xval,INDEX(_x,,1),
    _xord,INDEX(_x,,2),
    _q,q,
    _lbl,IF(ISOMITTED(labels),SEQUENCE(_q),labels),
    _ret,IF(ISOMITTED(return),"row labels",return),
    _rnk,SCAN(0,_s,
          LAMBDA(a,b,
            IFS(
              b=1,1,
              INDEX(_xval,b-1,1)=INDEX(_xval,b,1),a,
              TRUE,a+1
            )
          )
         ),
    _mxrank,MAX(_rnk),
    _brk,_mxrank/_q,
    _quo,QUOTIENT(_rnk-1,_brk),
    _xlbl,IF(
            _q<>ROWS(_lbl),
            "Label array is not the same size as q",
            SORTBY(INDEX(_lbl,_quo+1),_xord,1)
          ),
    _u_quo,UNIQUE(_quo),
    _maxs,MAP(_u_quo,LAMBDA(u,MAX(FILTER(_xval,_quo=u)))),
    _actual_mins,MAP(_u_quo,LAMBDA(u,MIN(FILTER(_xval,_quo=u)))),
    _freqs,MAP(_u_quo,LAMBDA(u,ROWS(FILTER(_xval,_quo=u)))),
    _global_min,INDEX(_actual_mins,1,1),
    _mins,MAKEARRAY(
            _q,
            1,
            LAMBDA(r,c,
              IF(
                r=1,
                _global_min-_global_min*0.01%,
                INDEX(_maxs,r-1,1)
              )
            )
          ),
    _grps,CHOOSE(
            {1,2,3,4,5,6},
            _lbl,
            "("&_mins&","&_maxs&"]",
            _mins,
            _maxs,
            "["&_actual_mins&","&_maxs&"]",
            _freqs
          ),
    _h,{"group","range","range_low","range_high","actual_range","frequencies"},
    _hgrps,MAKEARRAY(
            _q+1,
            6,
            LAMBDA(r,c,
              IF(
                r=1,
                INDEX(_h,1,c),
                INDEX(_grps,r-1,c)
              )
            )
           ),
    IF(_ret="row labels",_xlbl,_hgrps)
  )
)
pd.qcut takes two required parameters:
- x – a one-dimensional vertical array of a continuous numerical variable
- q – an integer representing the number of bins or groups we want to split that variable into
Additionally, we can provide two optional parameters:
- labels – a one-dimensional array of group labels we can assign to the groups created. The number of items in labels must be equal to q. If no value is provided for this parameter, a default array of SEQUENCE(q) is used for the group labels. That is, a list of integers starting at one and ending at q
- return – either:
- “row labels”, which returns an array the same shape as x, where each item in is one of the group names present in labels, or
- “groups”, which returns an array with a header row plus q rows – one for each group – and 6 columns:
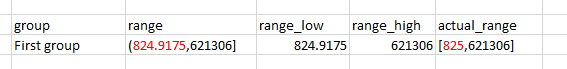
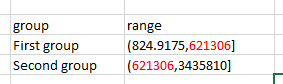
- group – containing the group label
- range – containing a value of the form (x,y] representing the open lower bound x and closed upper bound y of the group created by the function
- range_low – containing the open lower bound of the group
- range_high – containing the closed upper bound of the group
- actual_range – containing a value of the form [a,b] representing the current actual low and high values found in each group. The sets represented in this column do not necessarily cover the entire range of the variable. They may have gaps between them. This is provided for reference and should not be used for further binning
- frequencies – containing the count of rows in each group
While this may be a somewhat simple return value, we can pass this array around, index it and generally make use of it in many other ways.
If you think this will be useful to you, please feel free to grab the gist and either import it into your Lambda-capable Excel version using the Advanced Formula Environment, or copy the function definition and paste it directly into a new Name in the Name Manager.
How it works
We start by defining some variables using LET:
=LAMBDA(x,q,[labels],[return],
  LET(
    _s,SEQUENCE(ROWS(x)),
    _x,SORT(CHOOSE({1,2},x,_s),1,1),
    _xval,INDEX(_x,,1),
    _xord,INDEX(_x,,2),
    _q,q,
    _lbl,IF(ISOMITTED(labels),SEQUENCE(_q),labels),
    _ret,IF(ISOMITTED(return),"row labels",return),
    _rnk,SCAN(0,_s,
          LAMBDA(a,b,
            IFS(
              b=1,1,
              INDEX(_xval,b-1,1)=INDEX(_xval,b,1),a,
              TRUE,a+1
            )
          )
         ),
- _s – a sequence of integers from 1 to ROWS(x)
- _x – here, we are adding _s as a new column to x. The 2-column array is sorted in ascending order by x. This is necessary for the binning process. The benefit here is we now have the sequence column re-ordered in the same way. So, if we want to order the output of pd.qcut in the same way as the input x, we can just use this second column as a sort-by array
- _xval – get the first column from _x, i.e. the values
- _xord – get the second column from _x, i.e. the original order of the values when they were passed in to the function
- _q – this is just a copy of q. Not strictly necessary, but by convention I prefer to structure names internal to the lambda with a leading underscore. This is a habit I picked up while programming in pl/pgsql. I admit, it’s not to everyone’s taste, but it helps me stay organized
- _lbl – if there is no array of labels provided, use SEQUENCE to create an array of integers the same length as _q and use that as the labels
- _ret – if there is no return type provided, default to “row labels”
- _rnk – the need here is to rank each item in _x. Unfortunately RANK.EQ does not work well with arrays, so this SCAN function performs the same purpose. If you’re not familiar with how SCAN works, you may want to read this.
- Scan (traverse, iterate through) the integers 1 through ROWS(x)
- For each integer:
- Check if it is 1. If so, set a to 1. If not:
- Compare the value of x at position b (the current integer in _s) with the value of x at position b-1. If they are the same, then return a, which is the previously determined output of SCAN at the prior iteration (this is known as the accumulated value)
- If they are not the same, set a to a+1
- The effect is to give adjacent values in x the same rank. This is important for our binning function to ensure that identical values are only ever in one bin. You may have noticed in the gif above that one bin consistently has a higher frequency count than the others. This is because there are three (artificially created) duplicate values in the population data I used for the example
Moving on:
    _mxrank,MAX(_rnk),
    _brk,_mxrank/_q,
    _quo,QUOTIENT(_rnk-1,_brk),
    _xlbl,IF(
            _q<>ROWS(_lbl),
            "Label array is not the same size as q",
            SORTBY(INDEX(_lbl,_quo+1),_xord,1)
          ),
    _u_quo,UNIQUE(_quo),
    _maxs,MAP(_u_quo,LAMBDA(u,MAX(FILTER(_xval,_quo=u)))),
    _actual_mins,MAP(_u_quo,LAMBDA(u,MIN(FILTER(_xval,_quo=u)))),
    _freqs,MAP(_u_quo,LAMBDA(u,ROWS(FILTER(_xval,_quo=u)))),
    _global_min,INDEX(_actual_mins,1,1),
- _mxrank – the maximum rank
- _brk – the maximum rank divided by q – this gives us the width of each group, or number of ranks, that should go into each group
- _quo – here we calculate an array of the quotients arrived at by dividing _rnk-1, which is just a list of integers from 0 to ROWS(x)-1, where duplicates in x have the same rank, by _brk. This array then is the same size as x and has an integer between 1 and q in each row
- _xlbl – we check that the number of rows in the _lbl variable is the same as the value passed for q. If they are different, the text shown is used. Otherwise, _xlbl is an array the same size as _quo (which is the same size as x), containing the correct labels from the appropriate position, but importantly: sorted in the same order as the array x that was passed into the function. This is to ensure that it can be aligned with the original data without much hassle should the calling function choose return=”row labels”
- _u_quo – the unique values in _quo
- _maxs – here we are using MAP to apply the function shown to each value u in _u_quo. For each value u, we filter _xval for those rows where the corresponding row in _quo is equal to u and then take the MAX of the result. So, we get a MAX for each u. These are then the upper boundaries of each group
- _actual_mins – similar to the definition of _maxs, we apply the MIN function to get the minimum value in each group
- _freqs – in a similar fashion, we use ROWS to count the number of items in each group
- _global_min – this is the first value in x. We need to get this so that we can set the lower boundary of the smallest group in a similar way to the Pandas method – by subtracting 0.01% from the lowest value. This allows the lower boundary to be slightly lower than the smallest value in the original array
Ok. We’re getting there. Just a few more steps:
    _mins,MAKEARRAY(
            _q,
            1,
            LAMBDA(r,c,
              IF(
                r=1,
                _global_min-_global_min*0.01%,
                INDEX(_maxs,r-1,1)
              )
            )
          ),
    _grps,CHOOSE(
            {1,2,3,4,5,6},
            _lbl,
            "("&_mins&","&_maxs&"]",
            _mins,
            _maxs,
            "["&_actual_mins&","&_maxs&"]",
            _freqs
          ),
    _h,{"group","range","range_low","range_high","actual_range","frequencies"},
    _hgrps,MAKEARRAY(
            _q+1,
            6,
            LAMBDA(r,c,
              IF(
                r=1,
                INDEX(_h,1,c),
                INDEX(_grps,r-1,c)
              )
            )
           ),
    IF(_ret="row labels",_xlbl,_hgrps)
  )
)
- _mins – here we are using MAKEARRAY to get the upper boundary of the previous group to serve as the open lower boundary of the current group. For the first group, we are subtracting 0.01% of the global minimum to set the lower boundary
The adjusted global minimum:
The maximum of the previous group used as the minimum of the current group:
- _grps – here we are building the bulk of the output array
- The first column will contain the group labels
- The second column will contain the set descriptions that span the full range of data
- The third column will contain the minimums of each set
- The fourth column will contain the maximums of each set
- The fifth column will contain the closed sets of the actual minimums and maximums. These sets do not necessarily span the entire range of x
- The sixth column will contain the frequencies for each group
- _h – a header row for the output array
- _hgrps – this is just stacking the header row on top of _grps. This becomes trivially simple when VSTACK is generally available
- Finally, the value returned to the spreadsheet is either:
- _xlbl, if return=“row labels”, or _hgrps if return=”groups” (or in fact, any value not equal to “row labels”)
And that’s that.
In summary
We saw how to create a lambda function called pd.qcut that allows us to group a continuous variable into bins of equal counts.
It can return either an array the same size as that variable, containing labelled representations of the bins, or a frequency table containing information about the bins, their boundaries, and the row counts assigned to each bin.
We can use INDEX on that frequency table to extract information about the bins and use it in other functions, names, or charts.
This was an interesting one for me to work through. I’m sure there are places it can be improved.
If you have any ideas for making the function faster or more efficient using generally available functions, please let me know in the comments.
Leave a Reply