Continuing from last week’s post about custom card views of Python objects, this post will describe how you can override the default card preview of a Pandas DataFrame. By understanding how this is done for one example, you’ll be able to override the default card preview of any Python object in Python in Excel.
The default card for a DataFrame
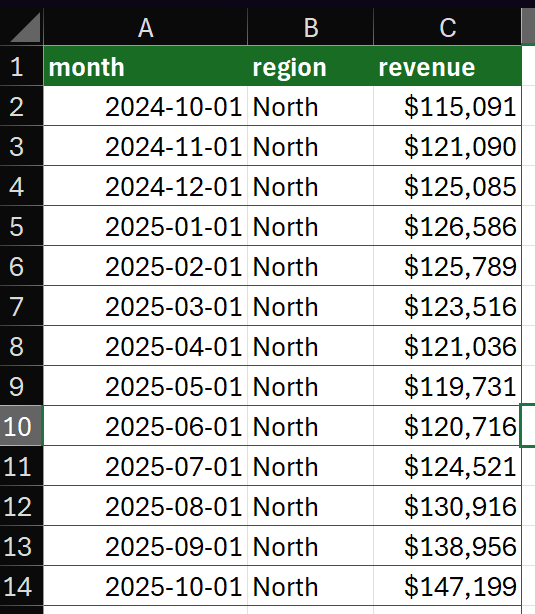
This post is using the same data as last week:
The default card preview for a DataFrame looks like this:
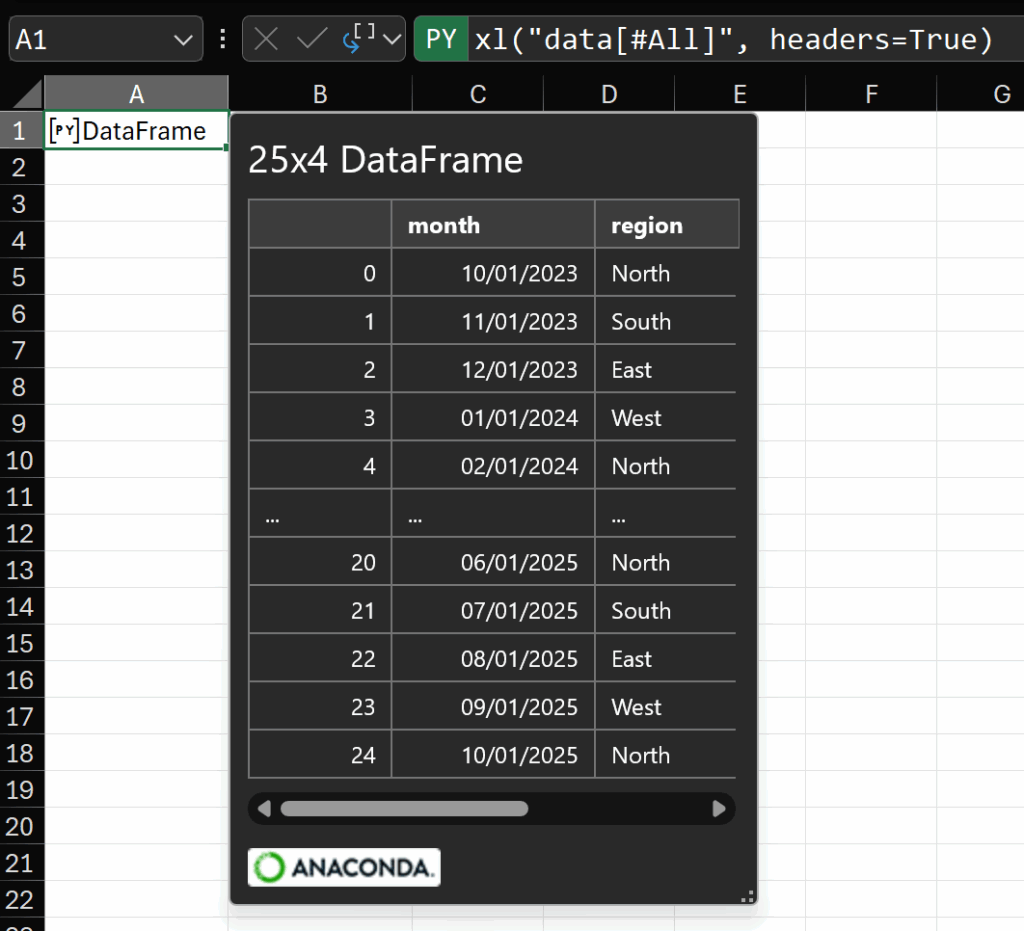
As you can see, we have some information about the number of rows and columns and a preview of the data. Generally speaking, I’m interested in the quality of the data in a DataFrame. I want to understand the spread of the data at a glance. So, I’d like to see descriptive statistics in the preview.
A custom DataFrame preview card
As we saw in last week’s post (read it here), we use what’s called a repr to customize how the card layout is defined. In that example, we built a new class which included additional properties of the DataFrame.
It’s not strictly necessary to build a new class to customize the card. Instead, we can create a function that returns the card definition and register that function as the preview repr for a DataFrame.
Here’s what such a function might look like:
def _repr_xl_preview_dataframe_custom(x: pd.DataFrame) -> any:


        props = {
            "Title": "DataFrame",
            "Data": x
        }

        desc = x.describe()

        # build a full list of descriptive statistics
        for idx, row in desc.reset_index().melt(id_vars="index").iterrows():
            props[row["variable"] + " " + row["index"]] = row["value"]


        # create the sections list with a section containing the full data
        sects = [{"layout": "List",
                "title": "Data",
                "properties": ["Data"],
                "collapsible": True,
                "collapsed": False}]

        # build one layout of descriptive statistics per column
        for col in desc.columns:
            sects.append(
                {"layout": "TwoColumn",
                "title": col + " stats",
                "properties": [col + " " + i for i in desc.index],
                "collapsible": True,
                "collapsed": True}
            )

        return {
            "type": "Entity",
            "text": "Pandas DataFrame",
            "properties": props,
            "layouts": {
                "card": {
                    "title": {"property": "Title"},
                    "layout": "Entity",
                    "sections": sects
                }
            }
        }
Recall from last week that a card is configured primarily with a dictionary of properties organized into a list of sections. So, the bulk of the code in the function above revolves around building that dictionary and placing those properties in the sections we want to see.
We start by defining the dictionary as containing only a title and the DataFrame itself:
        props = {
            "Title": "DataFrame",
            "Data": x
        }
I mentioned I wanted to see descriptive statistics, so next, we create a variable containing those statistics. Recall that to do so in Pandas, we call .describe() on a DataFrame:
desc = x.describe()
If we were to look at the result of this line in Excel, it would look like this:
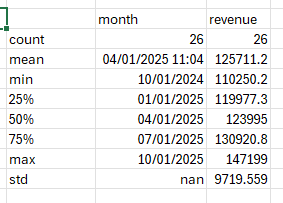
This is great, but desc is a DataFrame. I want to display the descriptive statistics in that DataFrame as separate properties in collapsible sections – one section per input DataFrame column. So next, we add one property for each row and column in the descriptive statistics.
        # build a full list of descriptive statistics
        for idx, row in desc.reset_index().melt(id_vars="index").iterrows():
            props[row["variable"] + " " + row["index"]] = row["value"]
Reading this code, it’s iterating over the rows of the melted version of the input DataFrame. Recall that melting means “unpivoting”. So one row per “column” + “statistic”. If there are 13 input rows, there are 26 melted rows.
For each melted row, we’re adding one property whose key is the variable name, a space, then the index of the statistics DataFrame (which is the statistic name, such as “count” or “mean”).
Next, we’re going to build the list of sections that will form the bulk of the repr return dictionary. We want the first section to just contain a copy of the input DataFrame so it can be extracted from the card preview using dot notation later if needed:
        # create the sections list with a section containing the full data
        sects = [{"layout": "List",
                "title": "Data",
                "properties": ["Data"],
                "collapsible": True,
                "collapsed": False}]
Next, we create a single section for each column in the input DataFrame. Each section will contain the descriptive statistics for the column in question.
        # build one layout of descriptive statistics per column
        for col in desc.columns:
            sects.append(
                {"layout": "TwoColumn",
                "title": col + " stats",
                "properties": [col + " " + i for i in desc.index],
                "collapsible": True,
                "collapsed": True}
            )
The key point to note here is that the “properties” node of this section is a list. The list is built from a list comprehension over the index of the descriptive statistics created earlier. This index is just the statistics names, shown in the left-most column of this image:
So the properties assigned to the section are those properties defined by the column name, a space, and the index item. In this way, each column’s section only contains the properties relevant to that column.
Now that we’ve built a full list of sections, it remains to return the full definition of the card preview:
        return {
            "type": "Entity",
            "text": "Pandas DataFrame",
            "properties": props,
            "layouts": {
                "card": {
                    "title": {"property": "Title"},
                    "layout": "Entity",
                    "sections": sects
                }
            }
        }
That’s the full definition of the custom card preview function (repr) for a Pandas DataFrame. But this alone is not enough to override the default behavior. As I mentioned earlier, we must also register this function as the repr for a DataFrame. We do that with this line:
excel.repr.register_repr_xl_preview(pd.DataFrame, _repr_xl_preview_dataframe_custom)
This is a built-in function in the excel.repr module. We pass the object to which we want to link our repr function, and a reference to the repr function itself (its name).
Once the function is defined, and the function is associated with a DataFrame, then any DataFrame created after that happens will use this new preview card.
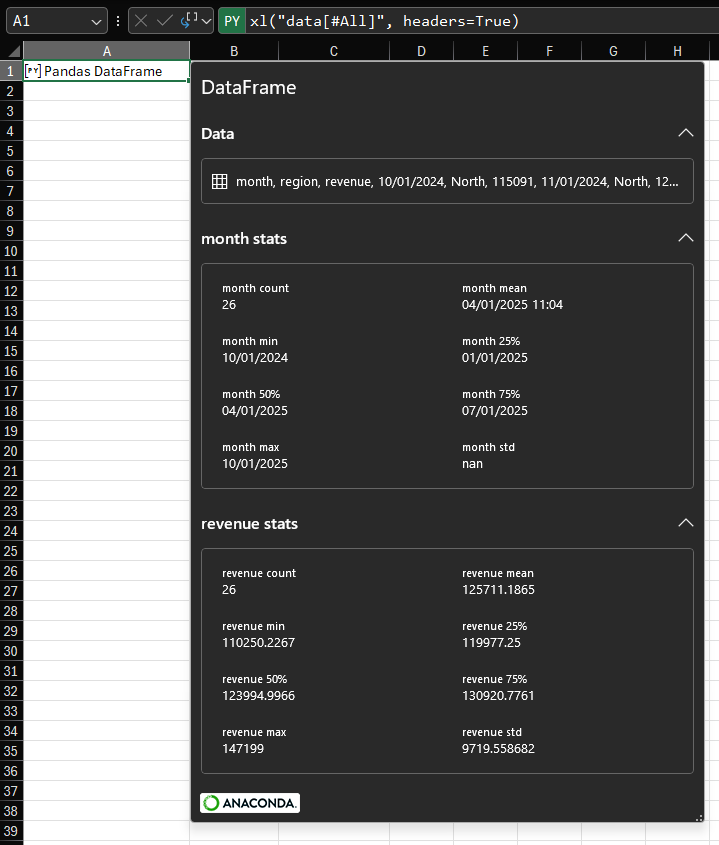
For the example data in this post, that custom preview looks like this:
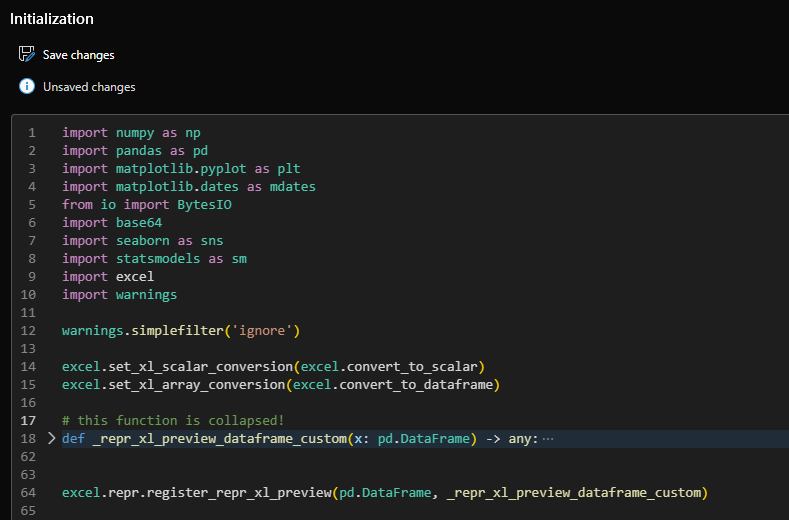
To make this work seamlessly for any DataFrame in the workbook, I recommend placing the code in the editable Initialization pane:
Summary
In this post we saw how to override the default card preview of a Pandas DataFrame. We designed a function that pre-calculates the descriptive statistics of a DataFrame and formats them into collapsible sections – one per column – so that those statistics are easily viewed and can be extracted from the Python object in a cell using dot-notation.
I hope this has been interesting and remember, now you know how to do this with a Pandas DataFrame, you can do it with any object!
Good luck and be sure to leave a comment if anything is not clear or if I can help with your trying out the approach in this post.
Leave a Reply