The gist for this lambda function can be found here.
The goal
When we have a dataset with lots of variables (features), we can simplify the modeling process by first trying to determine which variables are correlated with one another.
If two variables are highly correlated, we can consider including only one of them in the model we build.
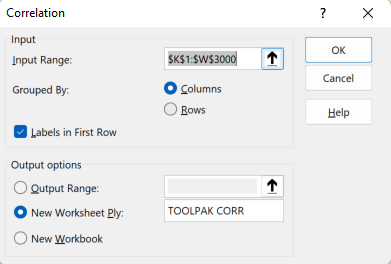
Excel provides a feature in Data Analysis Toolpak called “Correlation”.
This function can be accessed by enabling the Data Analysis Toolpak, then following the on-screen instructions for the Correlation function.
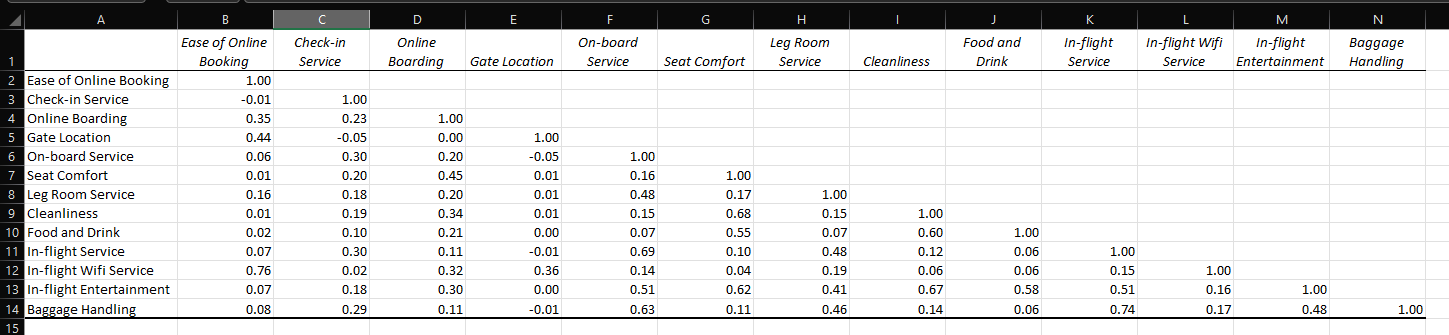
The output of this feature is to produce the lower-triangular correlation coefficient matrix. The output looks like this:
You can read more about the Correlation function and the other features of the Data Analysis Toolpak here.
By default, this feature uses the Pearson product moment correlation coefficient to populate the matrix. One of the assumptions for use of this coefficient is that the variables under consideration display normality.
This assumption doesn’t necessarily hold for some variables – such as likert-scaled data.
In such cases it is useful to be able to use the Spearman’s rank correlation coefficient, where the variables are first ranked individually, before being compared using the same calculation as the Pearson method.
The goal here then, is:
Create a lambda function that will dynamically build a correlation coefficient using either the Pearson or Spearman rank methods of calculation
A solution
Here’s a lambda function called CORRELMATRIX:
=LAMBDA(x,[has_header],[ranked],
  IF(COLUMNS(x())<2,"x must be at least 2 columns",
    LET(
      _c,COLUMNS(x()),
      _hashead,IF(ISOMITTED(has_header),FALSE,has_header),
      _head,IF(_hashead,INDEX(x(),1,),"Column "&SEQUENCE(1,_c)),
      _rnkd,IF(ISOMITTED(ranked),FALSE,ranked),
      _corner,IF(_rnkd,"Spearman ranked","Pearson"),
      _nohead,LAMBDA(arr,INDEX(arr,2,):INDEX(arr,ROWS(arr),)),
      _r,ROWS(x())-IF(_hashead,1,0),
      _ranks,IF(
              _rnkd,MAKEARRAY(_r,_c,
                      LAMBDA(r,c,
                        LET(
                          _x,IF(_hashead,_nohead(x()),x()),
                          RANK.AVG(
                            INDEX(_x,r,c),
                            INDEX(_x,,c)
                          )
                        )
                      )
                    ),
              IF(
                _hashead,
                _nohead(x()),
                x()
              )
             ),
      _cor,MAKEARRAY(_c+1,_c+1,
            LAMBDA(r,c,
              IFS(
                AND(r=1,c=1),_corner,
                r=1,INDEX(_head,1,c-1),
                c=1,INDEX(_head,1,r-1),
                TRUE,CORREL(
                  INDEX(_ranks,,r-1),
                  INDEX(_ranks,,c-1)
                )
              )
            )
           ),
      _cor
    )
  )
)
This one required parameter and two optional parameters:
- x – a thunked array of 2:n numeric columns of equal size for which to calculate the correlation of each pair of 2 columns.
- Please note that due to a peculiarity of how the RANK.AVG function works within MAKEARRAY, this first parameter must be passed as a thunk. So, if you want to analyse the range X2:Y500, you must specify x as LAMBDA(X2:Y500)
- has_header (optional) – TRUE if the first row of x contains column headers. If omitted or FALSE, x is assumed to not include a header row
- ranked (optional) – if TRUE, calculate the Spearman’s rank correlation coefficient. If FALSE or omitted, calculate the Pearson correlation coefficient
Since the calculation of the Spearman rank correlation coefficient involves first calculating the rank of each variable in the input dataset x, it can be considerably slower than when calculating using the Pearson method, so if you choose to use this function, please be cautious of total number of variables and total number of rows.
I’ve tested the Spearman version over 10000 rows for 16 variables and it returns the matrix in approximately 20 seconds on my i7 with 16GB of ram. The Pearson version returns the matrix on the same data in just under 3 seconds.
This is how it works:
Unlike the Data Analysis Toolpak, CORRELMATRIX returns the full matrix, including the upper diagonal entries. Note of course that these are identical to the opposite number in the lower diagonal.
How it works
Let’s break it down:
=LAMBDA(x,[has_header],[ranked],
  IF(COLUMNS(x())<2,"x must be at least 2 columns",
    LET(
      _c,COLUMNS(x()),
      _hashead,IF(ISOMITTED(has_header),FALSE,has_header),
      _head,IF(_hashead,INDEX(x(),1,),"Column "&SEQUENCE(1,_c)),
      _rnkd,IF(ISOMITTED(ranked),FALSE,ranked),
      _corner,IF(_rnkd,"Spearman ranked","Pearson"),
      _nohead,LAMBDA(arr,INDEX(arr,2,):INDEX(arr,ROWS(arr),)),
      _r,ROWS(x())-IF(_hashead,1,0),
To begin with, we’re checking that the x thunk (we know it’s a thunk because of that empty parenthetical) has at least 2 columns. That’s the minimum number of columns we can calculate a correlation coefficient for. If we have fewer than 2 columns, we just return the descriptive error value shown.
Next, we define some variables to use in the creation of the output array:
- _c – here we are storing the number of columns in the input array
- _hashead – if the has_header parameter is omitted, it is assumed to be FALSE. Otherwise, we store the value passed into the has_header parameter
- _head – here we are creating a single-row array of column headers. If has_header=FALSE, this is constructed as an array of values {“Column 1″,”Column 2″,…,”Column n”}. If has_header=TRUE, this array is just the first row of the input array
- _rnkd – if the ranked parameter is omitted, it’s assumed to be FALSE. Otherwise, we store the value passed into the ranked parameter
- _corner – based on whether the _rnkd variable is TRUE or FALSE (as determined previously), we store either of the relevant text values shown. This _corner variable will be placed in the top-left cell of the output array as an indication of whether the matrix contains Pearson or Spearman rank coefficients
- _nohead – here we define a lambda function that will strip the first row off the top of an input array. When Excel’s native TAKE function becomes generally available, this will no longer be necessary
- _r – here we’re defining the length of the array of numbers that will be used to calculate the coefficients. If the input array has a header row, this count of rows must be one fewer than the rows in the input array. Otherwise, it’s the same size as the input array.
Next we create an array of just the numbers to use in the calculations:
      _ranks,IF(
              _rnkd,MAKEARRAY(_r,_c,
                      LAMBDA(r,c,
                        LET(
                          _x,IF(_hashead,_nohead(x()),x()),
                          RANK.AVG(
                            INDEX(_x,r,c),
                            INDEX(_x,,c)
                          )
                        )
                      )
                    ),
              IF(
                _hashead,
                _nohead(x()),
                x()
              )
             ),
We’re defining a variable called _ranks.
If _rnkd=TRUE, then we use MAKEARRAY to build an array the same size as the input array x but containing their column-wise RANK.AVG values. If the input array has a header row, we remove it using the _nohead lambda function defined previously.
If _rnkd=FALSE, then we expect to use the Pearson method, for which we don’t need to transform the data (other than removing the header row – again, using the _nohead lambda function defined above).
Finally we build the correlation matrix using the data in the _ranks variable:
      _cor,MAKEARRAY(_c+1,_c+1,
            LAMBDA(r,c,
              IFS(
                AND(r=1,c=1),_corner,
                r=1,INDEX(_head,1,c-1),
                c=1,INDEX(_head,1,r-1),
                TRUE,CORREL(
                  INDEX(_ranks,,r-1),
                  INDEX(_ranks,,c-1)
                )
              )
            )
           ),
      _cor
    )
  )
)
Again, we use MAKEARRAY to create a matrix called _cor.
The matrix has the same number of columns and rows as there are columns in the input array x. Plus one additional row for the column headers and one additional column for the row headers.
Recall that the LAMBDA used inside MAKEARRAY has two parameters to indicate the row position and the column position respectively. By convention, I always use r and c for these parameters.
We place the _corner variable in the top-left cell, as mentioned above.
In the first row, we place the value found in the (c-1)th column of the _head header array.
In the first column, we place the value found in the (r-1)th column of the _head header array.
In the main body of the output array, we calculate the CORREL function on whatever numbers are in the _ranks array defined previously. If the ranked parameter were TRUE, we are expecting _ranks to contain the ranks of each of the variables, and therefore using CORREL on an array of ranked data returns the Spearman rank correlation coefficient matrix.
Finally, we return the variable _cor to the calling function in the spreadsheet.
In summary
We briefly reviewed the correlation feature of the Data Analysis Toolpak.
We saw how to create a lambda function to calculate a correlation coefficient matrix in Excel.
The lambda function can calculate both the Pearson correlation coefficient and the Spearman’s rank correlation coefficient (useful for ordinal variables).
Leave a Reply