The gist for this set of functions can be found here.
The goal
This post is not intended to be an instruction on the mathematics or theory of outlier detection.
My intention is to demonstrate another way we can use lambda in Excel to simplify a common task.
This post will show you how to create a lambda function that will:
- Transform a continuous variable to correct for right-skew
- Calculate the upper and lower boundaries outside which we might consider a data point to be an outlier
- Return a dynamic array that includes
- The original data
- The transformed data
- A boolean (TRUE/FALSE) column indicating whether the test considers a row an outlier, and
- A column indicating whether we can consider a flagged outlier as “Low” or “High”
The data
The dataset I used for this post is the Kaggle Wine Quality dataset, which includes several variables about different wines. The variable I use throughout is the “sulphates” column.
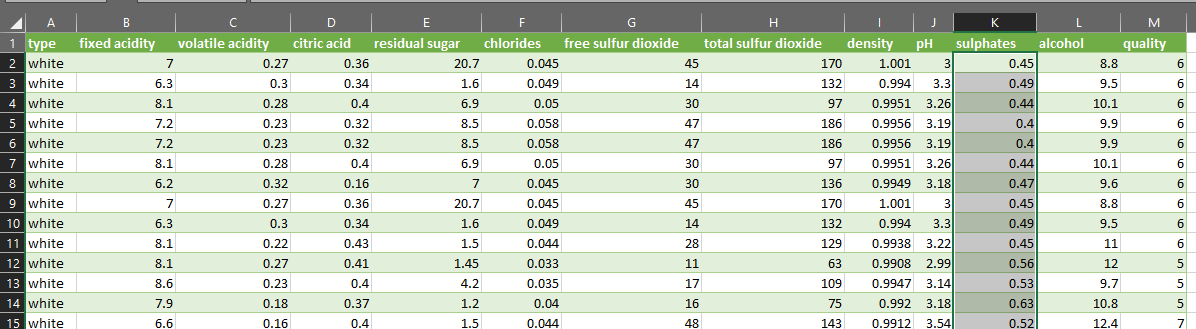
I saved the winequality.csv file to my computer and used PowerQuery to load it into Excel. I didn’t perform any other transformations on the data.
The problem
I would like to calculate the mean (average) of the sulphates variable.
To do this in a way that produces a decent estimate of the center of the distribution, I need to be sure there are no outliers in my dataset. A histogram of the sulphates column looks like this:
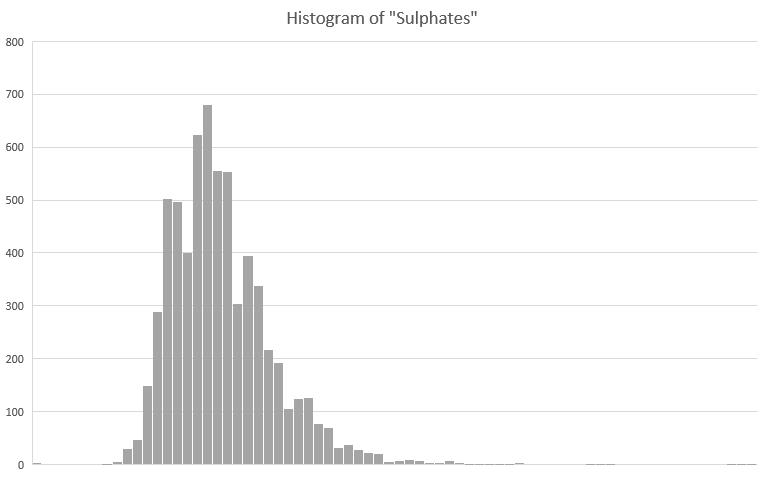
You can see that the distribution is slightly right-skewed. This is confirmed if we use the DESCRIBE lambda on the variable. You can see that the kurtosis and skewness of the variable are pronounced:
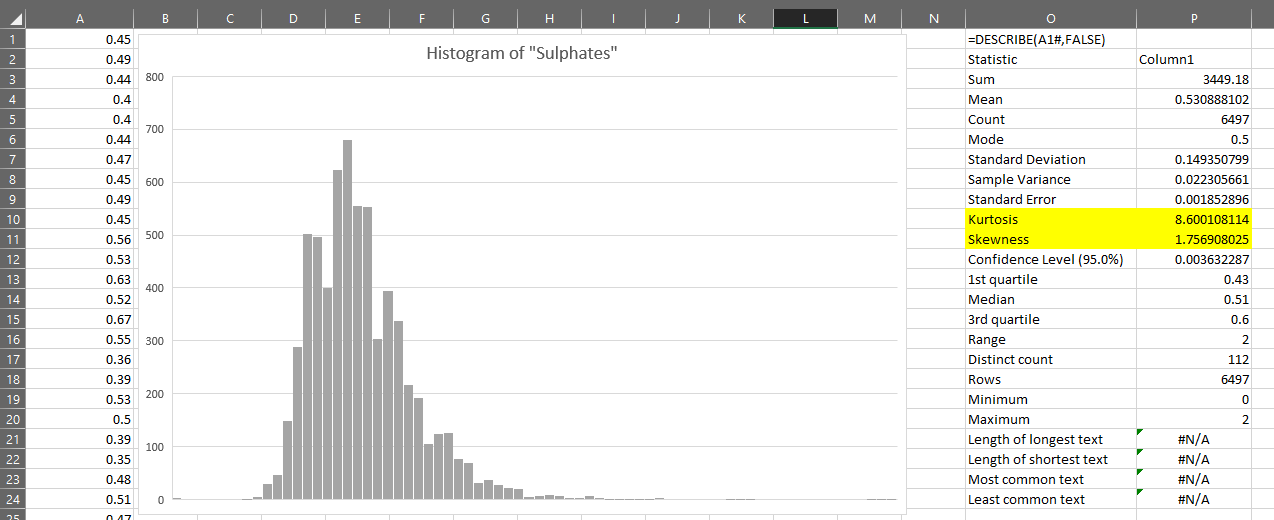
The kurtosis is particularly high, being a numerical representation of the long right-tail we can see in the chart.
The mean of this kind of distribution is generally very sensitive to data points in the ends of the tail – they will have an out-sized influence on the mean.
Our task here will be to somehow remove extreme values such that the mean is not biased by these outliers.
To do so, we can use what is commonly called a standard deviation test.
On a close to normally distributed variable, we can calculate the mean and standard deviation of that variable and then test each value to see if it is either more or less than some multiple of the standard deviation from the mean.
Transforming the variable
The distribution of the sulphates variable above is skewed, as we’ve seen.
In order to use the standard deviation test, we will need to first apply a transformation to the variable.We will apply the test to the transformed value and then map the identified outliers back to the original distribution.
For a straightforward introduction to transformations to correct skewness, I recommend this page.
=SQRT
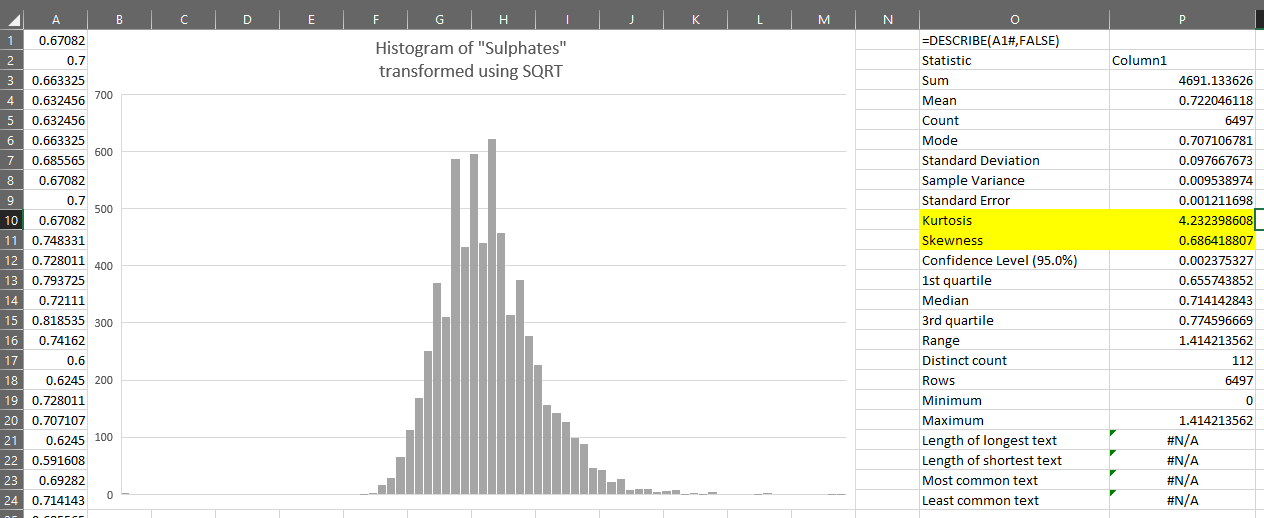
As shown in the link, one transformation we can apply to correct moderate right-skew is the square root transformation.
Doing this in Excel with dynamic arrays is simple – we just use the SQRT function.
We can see that this transformation looks closer to normally distributed than the original variable and that the kurtosis and skewness have reduced:
=LN
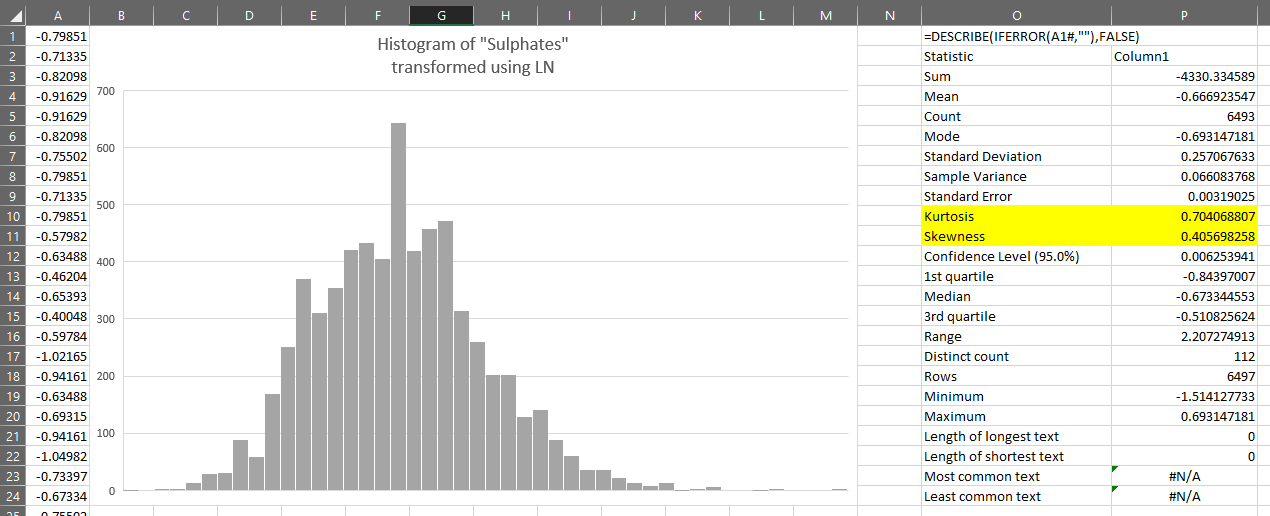
Another transformation we can apply is the natural logarithm, which is calculated using the LN function.
This seems to give us better results. The kurtosis is now significantly reduced:
=LOG
Yet another transformation we can apply is the logarithm using base 10. This is done with the LOG function.
Similar to the LN transformation, this produces better results than SQRT for this variable: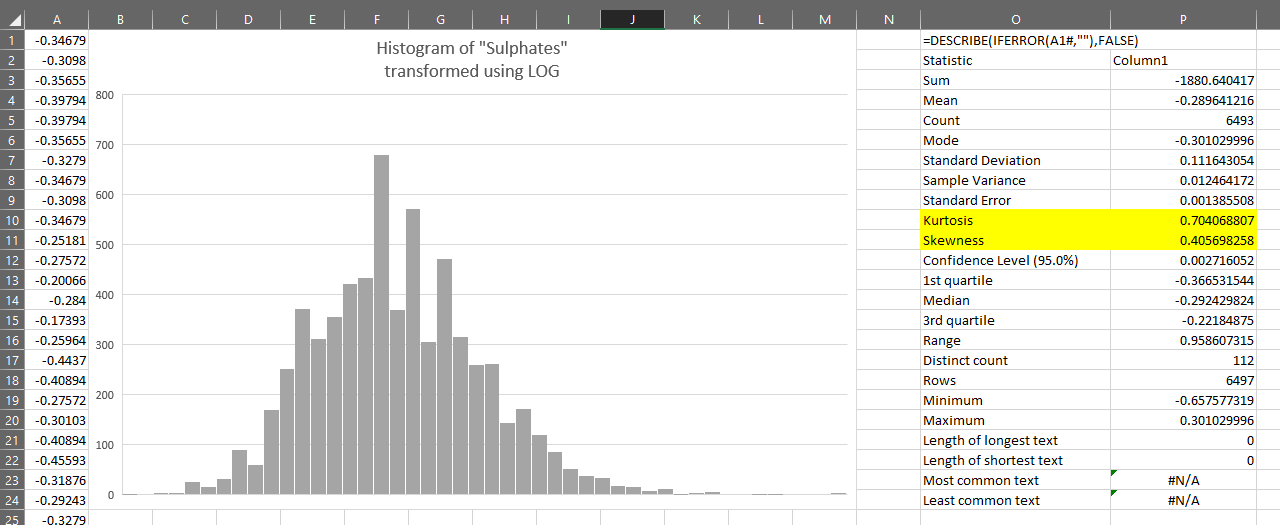
Outlier thresholds
Suppose we decide to use the LOG transformed variable to find the outliers.
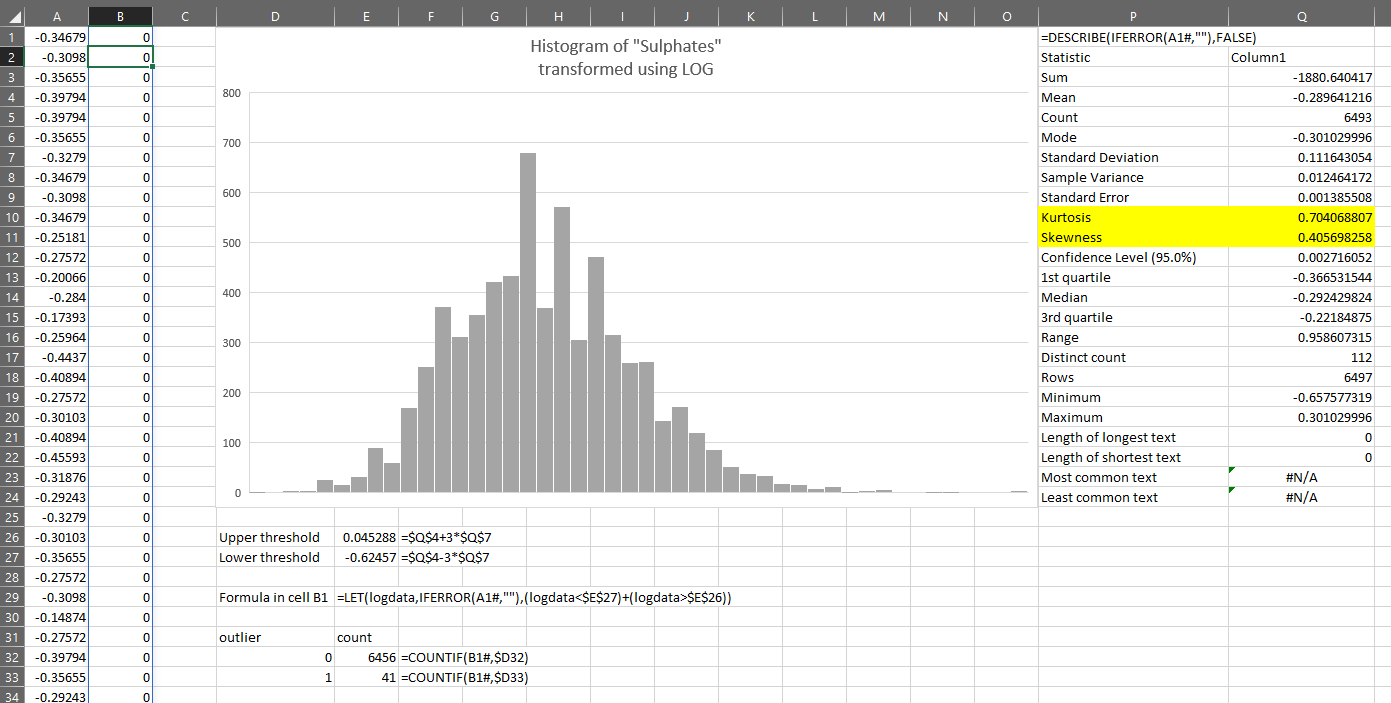
If we want to find which values are more than 3 standard deviations from the mean, we can calculate the thresholds on the sheet shown above:
Upper threshold =$P$4+3*$P$7
Lower threshold =$P$4-3*$P$7
We can then test each value in column A against these thresholds. If the value is either above the upper threshold or below the lower threshold, we will consider it suspicious and possibly an outlier.
To test whether a value is an outlier, we just put this in cell B1:
=LET(logdata,IFERROR(A1#,””),(logdata<$E$27)+(logdata>$E$26))
We can see that this has identified 41 records which might be outliers:
This is fine, but I need to know which values in my original data are represented by each of those 41 values in the log-transformed data.
I could put the original data again in column C and line them up. Then I could filter column C for just those rows where column B is equal to 0 (i.e. probably not an outlier).
Then finally I could calculate the mean of just those non-outlier rows.
And then repeat ALL those steps for LN and for any other transform I want to verify.
If you do this kind of thing often, it could get tedious. It’s an opportunity for a lambda or two.
The lambdas
OUTLIER.THRESHOLDS
First, consider this: the calculation of the thresholds is the same whether we use SQRT, LN, LOG or any other transformation of the original data.
This is OUTLIER.THRESHOLDS:
=LAMBDA(data,std_devs,
  LET(
    _data,FILTER(data,NOT(ISERROR(data))),
    _std_devs,std_devs,
    _mean,AVERAGE(_data),
    _std_dev,STDEV.S(_data),
    _lower,_mean-_std_devs*_std_dev,
    _upper,_mean+_std_devs*_std_dev,
    CHOOSE({1,2},_lower,_upper)
  )
)
This is quite a simple lambda. We pass in two parameters:
- data – this is just a range or dynamic array
- std_devs – the number of standard deviations (the multiplier) we want to use to calculate the thresholds
We define some variables:
- _data – the data with errors removed using FILTER
- _std_devs – a copy of the std_devs parameter. Not strictly necessary to do this, but I include this for sake of naming convention within LET
- _mean – the average of the filtered data
- _std_dev – the standard deviation of the filtered data
- _lower – we subtract _std_devs standard deviations from the mean to calculate the lower threshold
- _upper – we add _std_devs standard deviations to the mean to calculate the upper threshold
Then finally we return a single-row, two-column array containing the lower threshold in the first column and the upper threshold in the second column.
Now, if we want the thresholds for the log transformed data, we just:
=OUTLIER.THRESHOLDS(LOG(data),3)
You can see it produces the same results as the formulas created earlier:
OUTLIER.TEST
Next, I’d like to be able to have three columns for each test I run:- The transformed data
- A boolean (TRUE/FALSE) column where TRUE indicates the value in that row might be an outlier, and
- A column showing “Low” for outliers below the lower threshold and “High” for outliers above the upper threshold
This is OUTLIER.TEST:
=LAMBDA(data,std_devs,[prefix],
  LET(
    _prefix,IF(ISOMITTED(prefix),"test",prefix),
    _thresholds,OUTLIER.THRESHOLDS(data,std_devs),
    _is_outlier,IFERROR(((data<INDEX(_thresholds,1,1))+(data>INDEX(_thresholds,1,2)))>0,FALSE),
    _outlier_type,IFS(
                    data<INDEX(_thresholds,1,1),"Low", data>INDEX(_thresholds,1,2),"High",
                    TRUE,""
                  ),
    _header,_prefix & {"_data","_is_outlier","_outlier_type"},
    _array,
    MAKEARRAY(
      ROWS(data)+1,
      3,
      LAMBDA(r,c,
        IF(
          r=1,INDEX(_header,1,c),
          CHOOSE(
            c,
            INDEX(data,r-1,1),
            INDEX(_is_outlier,r-1,1),
            INDEX(_outlier_type,r-1,1)
          )
        )
      )
    ),
    _array
  )
)
While this may look slightly more complex, most of the effort here is going into building the output array. Unfortunately I do not have access to the new VSTACK and HSTACK functions, so this is more difficult than it will be when those become available.
We have three parameters for OUTLIER.TEST:
- data – the data we want to test. For example: LOG(A1#)
- std_devs – the number of standard deviations we want to use to calculate the thresholds
- prefix (optional) – this function will produce an array with three columns called “data”, “is_outlier” (TRUE/FALSE) and “outlier_type” (low/high). If we pass a text string such as “log” to prefix, the output column headers will be log_data, log_is_outlier and log_outlier_type
=LAMBDA(data,std_devs,[prefix],
  LET(
    _prefix,IF(ISOMITTED(prefix),"test",prefix),
    _thresholds,OUTLIER.THRESHOLDS(data,std_devs),
    _is_outlier,IFERROR(((data<INDEX(_thresholds,1,1))+(data>INDEX(_thresholds,1,2)))>0,FALSE),
    _outlier_type,IFS(
                    data<INDEX(_thresholds,1,1),"Low", data>INDEX(_thresholds,1,2),"High",
                    TRUE,""
                  ),
    _header,_prefix & {"_data","_is_outlier","_outlier_type"},
- _prefix, where we provide a default string of “test” if no value has been passed for the prefix parameter
- _thresholds, where we use the OUTLIER.THRESHOLDS function to return the lower and upper thresholds into a two-column, single-row array (as described above)
- _is_outlier, where we compare each of the values in data with both the upper and lower thresholds and produce a single-column array with the same number of rows as data which is TRUE if the row in data is an outlier, or FALSE otherwise
- _outlier_type, where if the value in data is lower than the lower threshold, we return the word “Low”, and if it’s higher than the upper threshold, we return the word “High”
- _header, where we define a header for the output array
    _array,
    MAKEARRAY(
      ROWS(data)+1,
      3,
      LAMBDA(r,c,
        IF(
          r=1,INDEX(_header,1,c),
          CHOOSE(
            c,
            INDEX(data,r-1,1),
            INDEX(_is_outlier,r-1,1),
            INDEX(_outlier_type,r-1,1)
          )
        )
      )
    ),
    _array
  )
)
Finally we create the output array, which has the same number of rows as data plus one for the header, and three columns.
We use a LAMBDA function with two parameters – r and c – representing the row and column positions in the array we are building.
If the row r is 1, then place the value from the equivalent column in _header in the output array.
Otherwise, use the column number to choose a value from the [r-1]th row of either data, _is_outlier, or _outlier_type.
Finally we return the array as the final parameter of LET.
Suppose I have my original data in column A, then I can test the distribution for outliers like this:
You can now use OUTLIER.TEST to quickly apply a series of steps to find outliers, but please remember:
No statistical test is fool-proof. You should visually inspect your outliers as well as use contextual information about the dataset to decide if the results of the test are appropriate
This may be enough.
Or sometimes you may want to apply several such tests on different transformations.
OUTLIER.TESTS
This lambda will allow you to apply the test as described above on any combination of SQRT, LN or LOG.
=LAMBDA(data,std_devs,[transforms],
  LET(
    _data,SORT(data),
    _std_devs,std_devs,
    _available,{"sqrt","ln","log10"},
    _transforms,LET(
                  t,IF(ISOMITTED(transforms),_available,transforms),
                  FILTER(t,(t="sqrt")+(t="ln")+(t="log10"))
                ),
    _do,IFERROR(XMATCH(_available,_transforms)>0,FALSE),
    _transformed,CHOOSE({1,2,3},SQRT(_data),LN(_data),LOG(_data,10)),
    _do_transformed,FILTER(_transformed,_do),
    _test,LAMBDA(x,y,z,LAMBDA(OUTLIER.TEST(x,y,z))),
    _tests,MAKEARRAY(
            1,
            COLUMNS(_do_transformed),
            LAMBDA(r,c,
              _test(INDEX(_do_transformed,,c),_std_devs,INDEX(_transforms,1,c))
            )
           ),
    _cols,1+COLUMNS(_tests)*3,
    _hdata,MAKEARRAY(ROWS(_data)+1,1,LAMBDA(r,c,IF(r=1,"original_data",INDEX(_data,r-1,1)))),
    _t1,INDEX(_tests,1,1)(),
    _t2,INDEX(_tests,1,2)(),
    _t3,INDEX(_tests,1,3)(),
    _array,
    CHOOSE(
      SEQUENCE(1,_cols),
      _hdata,
      INDEX(_t1,,1),
      INDEX(_t1,,2),
      INDEX(_t1,,3),
      INDEX(_t2,,1),
      INDEX(_t2,,2),
      INDEX(_t2,,3),
      INDEX(_t3,,1),
      INDEX(_t3,,2),
      INDEX(_t3,,3)
    ),
    _array
  )
)
Unfortunately, because it is performing several complicated calculations and building and appending arrays recursively, it is not particularly fast. Nevertheless, the simplicity and repeatability gained is still an advantage over doing this manually each time.
You can see that OUTLIER.TESTS returns an array including the original data, and the results of each call to OUTLIER.TEST as described above.
With OUTLIER.TESTS, we can inspect each of the rows flagged as outliers across multiple tests at once. This can give us important contextual information about the data.
The inner workings of OUTLIER.TESTS are more complex, but if you’d like to understand how it works, please read on.
How OUTLIER.TESTS works
The lambda takes three parameters:
- data – which is the original data variable
- std_devs – the number of standard deviations to use in each test
- [transforms] (optional) – this is a single-row array of transformations to apply to the data. Allowed values are “sqrt”, “ln” and “log10”
=LAMBDA(data,std_devs,[transforms],
  LET(
    _data,SORT(data),
    _std_devs,std_devs,
    _available,{"sqrt","ln","log10"},
    _transforms,LET(
                  t,IF(ISOMITTED(transforms),_available,transforms),
                  FILTER(t,(t="sqrt")+(t="ln")+(t="log10"))
                ),
    _do,IFERROR(XMATCH(_available,_transforms)>0,FALSE),
    _transformed,CHOOSE({1,2,3},SQRT(_data),LN(_data),LOG(_data,10)),
    _do_transformed,FILTER(_transformed,_do),
We start by defining some variables using LET:
- _data – we sort the original data in ascending order so that the output array is also sorted
- _std_devs – a copy internal to LET of the std_devs parameter. As mentioned above, this is not strictly necessary but more out of respect for naming conventions inside the lambda
- _available – this is a list of the available tests. It will be used to either check the contents of [transforms] or provide a default value to _transforms
- _transforms – here we provide a default value in case there is no value for the [transforms] parameter. We then make sure the only values present in _transforms are those with recognized transformations in this function
- _do – here we build a one-row, three-column array of TRUE/FALSE values indicating which transformations we will perform the test on. For example, if the first element in the array created here is TRUE, we will perform the test on SQRT(data)
- _transformed – here we create a three-column array with the transformations applied to _data
- _do_transformed – here we are filtering the columns of _transformed so we only have the transformations with a TRUE in _do
THUNK?!
The next two definitions may be the most difficult to grasp as they use a technique called “thunking”. If you don’t know what that is, you’re not alone. If you’d like to learn more then on your head be it.
I found this concept difficult to grasp when I first encountered it.
Read the linked article. Read Wikipedia. If you still don’t understand it after that, then I don’t blame you. It’s not an intuitive concept and I needed to read those pages several times to understand how to use it in Excel lambda. That said, if I had to summarize it, I would say:
A thunk lets us pass a function around a program without executing that function until we need to use it
In Excel lambdas, this let’s us define an array of function calls. It’s typically used because we cannot currently define an array of arrays. If the function we want to create returns an array, this means we may need to use a thunk.
    _test,LAMBDA(x,y,z,LAMBDA(OUTLIER.TEST(x,y,z))),
    _tests,MAKEARRAY(
            1,
            COLUMNS(_do_transformed),
            LAMBDA(r,c,
              _test(INDEX(_do_transformed,,c),_std_devs,INDEX(_transforms,1,c))
            )
           ),
Here,
- _test – is a thunk of the OUTLIER.TEST function.
- _tests – is an array with 1 row and the same number of columns as the transformations we want to test. The array is populated by calls to and results from the thunk _test. If we have passed {“ln”,”log10″} into the [transforms] parameter, then _tests will be one row and two columns. Each element will contain a call to OUTLIER.TEST, where the first parameter is INDEX(_do_transformed,,c), which is to say the transformed data in position c of that array. The second parameter is the number of standard deviations, and the third parameter is the prefix for the output, which will just be the name of the transformation in the _transforms variable
Think of it like this:
While _tests will only have two columns and one row (in the example above), the content of each cell in _tests will be an entire array returned by OUTLIER.TEST
Clear as mud? Ok let’s move on.
    _cols,1+COLUMNS(_tests)*3,
    _hdata,MAKEARRAY(ROWS(_data)+1,1,LAMBDA(r,c,IF(r=1,"original_data",INDEX(_data,r-1,1)))),
    _t1,INDEX(_tests,1,1)(),
    _t2,INDEX(_tests,1,2)(),
    _t3,INDEX(_tests,1,3)(),
    _array,
    CHOOSE(
      SEQUENCE(1,_cols),
      _hdata,
      INDEX(_t1,,1),
      INDEX(_t1,,2),
      INDEX(_t1,,3),
      INDEX(_t2,,1),
      INDEX(_t2,,2),
      INDEX(_t2,,3),
      INDEX(_t3,,1),
      INDEX(_t3,,2),
      INDEX(_t3,,3)
    ),
    _array
  )
)
We define:
- _cols – 1 (for the original data) plus 3 columns for each test of a transformed variable
- _hdata – here I am just adding a row to the top of _data so that it aligns with the results of each test (which have headers). This will be significantly simpler when VSTACK is in general availability
Next, we actually create the arrays from the tests:
- _t1 – the first test result
- _t2 – the second test result, if it exists. If _tests only has one column, this will return an error value (which doesn’t matter)
- _t3 – the third test result, if it exists. If _tests only has one or two columns, this will return an error value (which doesn’t matter)
And finally:
- _array – where we use CHOOSE to horizontally stack the columns into an output. The first column is the original data, then each subsequent column is a column from one of the test variables just defined above. The important thing to note here is that the SEQUENCE is only as long as _cols, so we have no risk of encountering either _t2 or _t3 when they are error values
Finally, we return _array to the spreadsheet so it can be used.
And the fun part about this? We can now use LET to store the result of OUTLIER.TESTS in a dynamic array which we can then do other calculations on – such as GROUPAGGREGATE to create a dynamic pivot of the outlier tests and where they overlap. We can of course also use INDEX to return only the is_outlier columns, or just the outlier_type columns.
In summary
If you’ve made it this far, thank you!
We looked at different transformations which can be applied to a variable to bring its distribution closer to normality.
We looked briefly at the simple standard deviation test for continuous variables
We explored how to calculate outlier thresholds for transformed variables, and introduced the OUTLIER.THRESHOLDS lambda.
We created a lambda called OUTLIER.TEST to return an array of information retrieved from applying the standard deviation test to a transformed variable.
We created a lambda called OUTLIER.TESTS which can return multiple calls to OUTLIER.TEST in a single array, for a more comprehensive view of potential outliers in our original data.
This was a fun exercise for me and I think I learned a good amount about performance and thunking in Excel lambda.
If you have any questions or comments, please leave them below!
Microsoft Excel Recalc Or Die says:
Outstanding Owen! I need to read it and more throughly…. Also, I will test it out on some personal dataset.
This is great work 👌.
I’m liking your style for blogging. I want to the same for project of mine with the excel charts.
me says:
Thanks, Carlos. To be honest, I just write it as I would like to read it. Sometimes I find interesting content online but it isn’t explained in a way that I can easily understand so I leave feeling a little confused about the topic. Admittedly, that may just be my ignorance of the topic! Nevertheless, I just try to put out something which makes sense. Hopefully it does.
Microsoft Excel Recalc Or Die says:
Owen, it was all good and chill until I got to the “thunking”. part🤯….have to say: you’ve created another monster 👌
Testing it out with a quick sample data, I can better grasp what you wrote on the article. Well done mate!
Indeed, LAMBDA is the future for more powerful #Excel 🔥
p.s. I might come up with an Excel chart to visualize these outliers, scatter plots or a dot plot seems good options. We’ll see. Again bravo! 👌👌👌👌👌!!!
me says:
Thanks! Thunking hurts my thinking.
carlos barboza says:
mate, I have come back here. To re-read this amazing post. Thank you for maintaining this blog. I need to also read your two following post after this one.