The gist for this lambda function can be found here.
Let me cut to the chase.
I have some data from Wikipedia for population by country . I’ve also got some data of land area by country, from here.
I created a Power Query to merge them. The output looks like this:
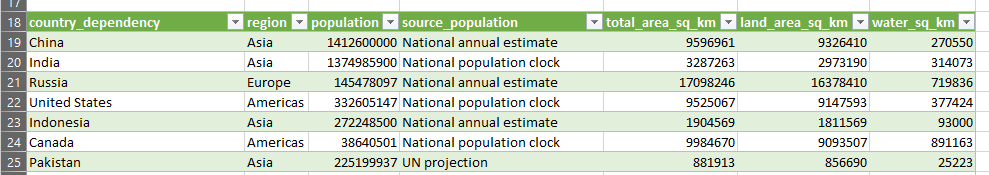
There are 195 rows in this table. I would like to create a summary table with these columns:
- Region
- Comma-separated list of countries in the region
- Total population of the region
- Maximum land area of any country in the region
The requirement to have a comma-separated list means that using a Pivot Table will not be so easy.
We can do it with formulas:
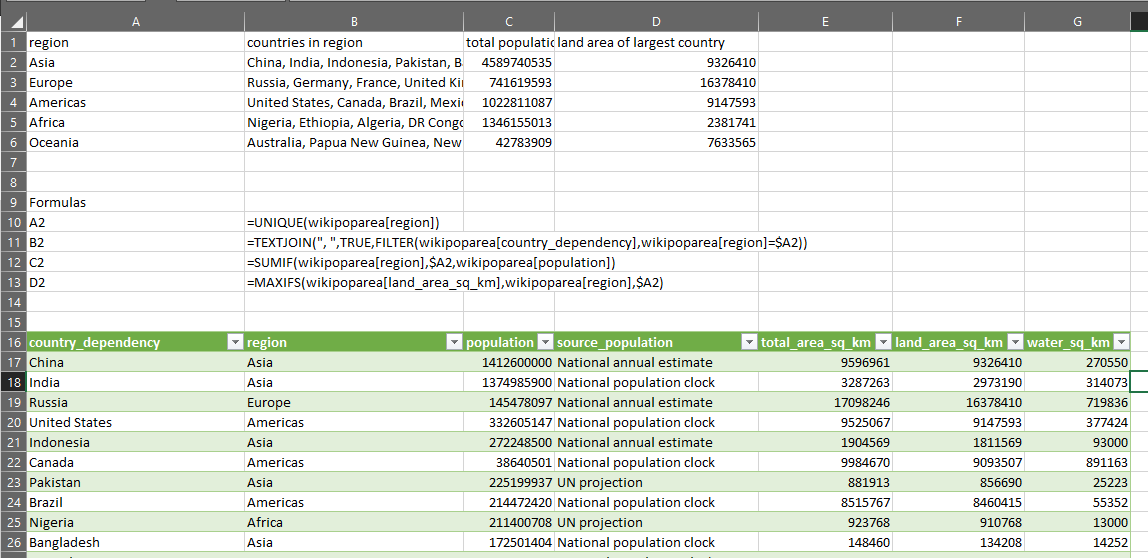
Easy enough. Four formulas.
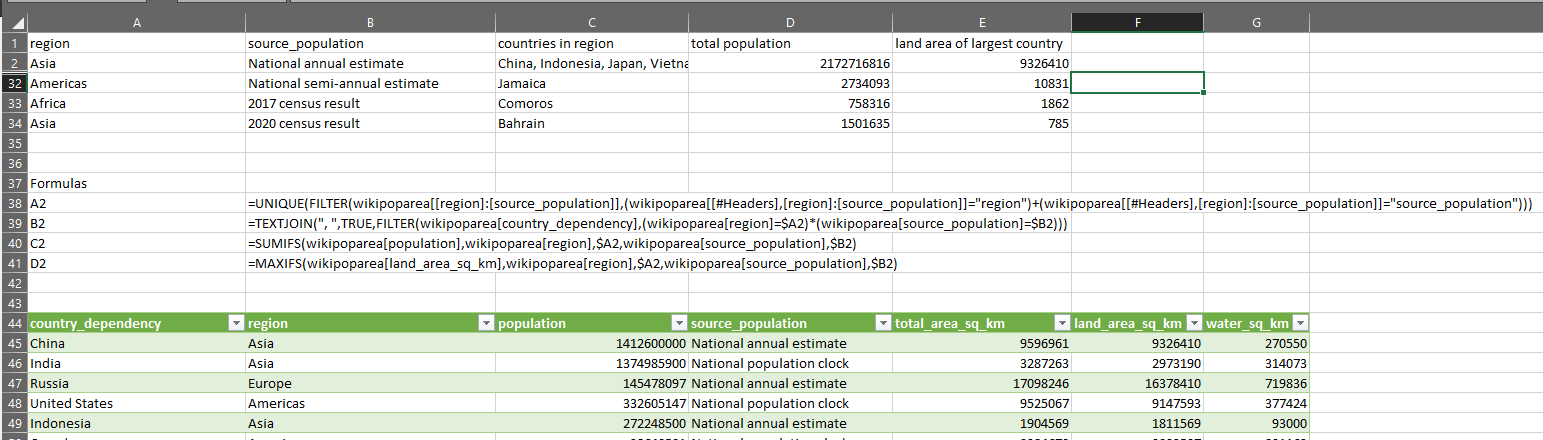
What if we want to produce the same table, but have region and source_population as row headers?
Well, first of all if we want to use UNIQUE to get the row headers, the formula becomes more complicated because there are two columns and they aren’t next to each other.
=UNIQUE(
	FILTER(
		wikipoparea[[region]:[source_population]],
		(wikipoparea[[#Headers],[region]:[source_population]]="region")
			+(wikipoparea[[#Headers],[region]:[source_population]]="source_population")
		)
	)
That formula is saying “take the unique values from the array formed by filtering the columns from region to source_population where the column header is either region or source_population”. The + in the middle there is what indicates OR.
Now for the comma-separated list of country names in each row.
=TEXTJOIN(
	", ",
	TRUE,
	FILTER(
		wikipoparea[country_dependency],
		(wikipoparea[region]=$A2)*(wikipoparea[source_population]=$B2)
		)
	)
We need to use two criteria in the include parameter of FILTER and multiply them. So here, we’re saying “filter the country_dependency column for those rows where the region column is equal to the value in cell A2 and the source_population column is equal to the value in cell B2″. Then, for that filtered list, join the text together and separate the country names using a comma”.
In a similar fashion, for the total population column, we will need this:
=SUMIFS(
	wikipoparea[population],
	wikipoparea[region],$A2,
	wikipoparea[source_population],$B2
	)
And for the land area of the largest country:
=MAXIFS(
	wikipoparea[land_area_sq_km],
	wikipoparea[region],$A2,
	wikipoparea[source_population],$B2
	)
You can see how these formulas quickly get longer as we add more grouping fields. And this is on top of the fact that we need a separate formula for each column.
You can imagine what it will be like with a more complicated table with three or four row headers.
This complexity got me thinking: is there a way we can write a LAMBDA function that will do all of this without all the hassle?
Well, it turns out there is.
This LAMBDA is called GROUPAGGREGATE:
=LAMBDA(
		dat,
		control,
		LET(
			group_control,control="group",
			group_dat,FILTER(dat,group_control),
			groups,UNIQUE(group_dat),
			group_cols,COLUMNS(groups),
			group_col_indices,LET(f,SEQUENCE(1,COUNTA(control))*(group_control),FILTER(f,f<>0)),
			val_col_indices,LET(f,SEQUENCE(1,COUNTA(control))*(group_control=FALSE),FILTER(f,f<>0)),
			result_arr,MAKEARRAY(
								ROWS(groups),
								COLUMNS(dat),
								LAMBDA(r,c,
										LET(measure_col,INDEX(val_col_indices,1,c-group_cols),
											measure,INDEX(
														RECURSIVEFILTER(dat,
																		group_col_indices,
																		INDEX(groups,r)
																		)
														,,measure_col
														),
											IF(
												c<=group_cols,INDEX(groups,r,c),
												CHOOSE(
														XMATCH(
																INDEX(control,1,measure_col),
																{"textjoin",
																"sum",
																"min",
																"max",
																"counta",
																"count",
																"average"}
																),
														TEXTJOIN(", ",FALSE,SORT(UNIQUE(measure))),
														SUM(measure),
														MIN(measure),
														MAX(measure),
														COUNTA(measure),
														COUNT(measure),
														AVERAGE(measure)
														)
												)
											)
										)
								)
			,result_arr
			)
		)
This is how it works:
GROUPAGGREGATE takes two parameters:
- dat – a range of data you want to summarize. In the gif above, I’ve selected some columns from my query
- control – an array of values with one row and the same number of columns as dat, where the values indicate what you want to do with each column in dat
You define an array of control values, which tell the function what to do with each column, then you pass the data into the first parameter and the control array into the second parameter. With the code above, you can use one of these values in the control array (which I have on row 1 in the gif above):
| control | description |
|---|---|
| group | Use if you want that column to be a row header in your summary table. You must have at least one column as a group |
| textjoin | Use if you want the values in that column to be comma-separated for each group |
| sum | Use if you want to sum the values in that column for each group |
| min | Use if you want to get the minimum of the values in that column for each group |
| max | Use if you want to get the maximum of the values in that column for each group |
| counta | Use if you want to count the values in that column for each group, including text values |
| count | Use if you want to count the numeric values in that column for each group |
| average | Use if you want to get the average of the values in that column for each group |
If you’re feeling brave, you can always extend the list of aggregates supported by modifying the LAMBDA for GROUPAGGREGATE.
If you’d like to use this function, you will need to grab the code for the RECURSIVEFILTER function from this page and define it as Named formula in your Name Manager in your workbook, then define GROUPAGGREGATE using the code above.
If you want to understand how GROUPAGGREGATE works, read on. Fair warning – it might get quite involved!
How it works
First of all, we create 6 variables:
| name | definition | |
|---|---|---|
|
control in the gif above is {“textjoin”,”group”,”sum”,”group”,”max”,”max”} control=”group” evaluates to {FALSE,TRUE,FALSE,TRUE,FALSE,FALSE} |
||
|
Return the columns from dat which have the word “group” in the control array. Since group_control = {FALSE,TRUE,FALSE,TRUE,FALSE,FALSE}, this filter returns the 2nd and the 4th columns (i.e. where there is a TRUE in group_control) |
||
| Returns the unique values from group_dat | ||
| The count of group columns. In our example, this is 2 | ||
|
Let “f” be a SEQUENCE of integers with 1 row and COUNTA(control) columns. So, if control has 6 items, then the sequence is {1,2,3,4,5,6}. Multiply that by group_control, which is {FALSE,TRUE,FALSE,TRUE,FALSE,FALSE}. The result is then {0,2,0,4,0,0}, because if we multiply a number by FALSE, it returns zero. We then FILTER f for where it’s not equal to zero. The result that is assigned to group_col_indices is then {2,4}. This is just the column indices of the columns that have the word “group” in the control parameter |
||
| This works in almost the same way as group_col_indices, except we are looking for columns which are NOT “group”. In this example, this returns {1,3,5,6} | ||
Now that these variables are assigned, we can do the tricky work of building the output array.
We’ll create a variable called result_arr and we’ll use MAKEARRAY to populate it. This is going to have the same number of rows as groups and the same number of columns as dat.
To populate the array, we use a LAMBDA function which has two parameters – r and c, representing the row and column position in the array.
First, we define a variable called measure_col. This will get the index from val_col_indices at the position (c – group_cols).
If we have two groups, then group_cols is 2.
If the output column c is 3 (i.e. the first non-group output column because there are 2 groups), then (c – group_cols) = 3 – 2 = 1 and we take the 1st item from val_col_indices.
val_col_indices is {1,3,5,6}, so the first item is 1. Column 1 in dat is country_dependency, and it’s corresponding control value is “textjoin”.
MAKEARRAY(
		ROWS(groups),
		COLUMNS(dat),
		LAMBDA(r,c,
				LET(measure_col,INDEX(val_col_indices,1,c-group_cols),
Next, we define the measure. This is returning the column at position measure_col from the result of the displayed call to RECURSIVEFILTER. The details of what RECURSIVEFILTER does exactly can be found here. It’s a little complex, very powerful and well worth reading about.
For the sake of this example, we are filtering dat (which is the dataset passed into the function) by the column numbers in group_col_indices (in our example, {2,4}) and the values in INDEX(groups,r). In the example above, that’s {“Asia”,”National annual estimate”}.
MAKEARRAY(
		ROWS(groups),
		COLUMNS(dat),
		LAMBDA(r,c,
				LET(measure_col,INDEX(val_col_indices,1,c-group_cols),
					measure,INDEX(
								RECURSIVEFILTER(dat,
												group_col_indices,
												INDEX(groups,r)
												)
								,,measure_col
								),
RECURSIVEFILTER will return a filtered subset of the main table which has the same values in the group columns as the current row of the output array.
On the first row of the output array, this is region=”Asia” and source=”National annual estimate”. So we grab all the rows from the main table with those values in those columns.
From that filtered subset of rows, we are then returning the column with index measure_col into the variable measure.
At this point, measure is just a single column of data for only those rows which match the filter (i.e. the row header of the output) and for only that column that needs to be aggregated.
Once we have that data, we can apply any kind of aggregation to it that we want.
Using RECURSIVEFILTER to get to an array of data to aggregate lets us side-step the need to use positional lists of parameters in functions like SUMIFS, MAXIFS, MINIFS and so on. We simply pass a column from RECURSIVEFILTER into SUM, MAX or MIN (or whatever other function we want to use)
The remainder of the function is saying: if the column number c is less than or equal to group_cols, then place the value from the groups variable on the row header.
If the column number c is greater than group_cols, then we know we need to place some aggregate of measure in the output array in this column.
We first get the control value for this column using INDEX(control,1,measure_col). For the input column country_dependency, the control value is “textjoin”, and we match it against the typed array shown below.
XMATCH(
		INDEX(control,1,measure_col),
		{"textjoin",
		"sum",
		"min",
		"max",
		"counta",
		"count",
		"average"}
		),
We find “textjoin” in the first position. We then take the first option from the list of options in the CHOOSE function.
CHOOSE(
		XMATCH(
				INDEX(control,1,measure_col),
				{"textjoin",
				"sum",
				"min",
				"max",
				"counta",
				"count",
				"average"}
				),
		TEXTJOIN(", ",FALSE,SORT(UNIQUE(measure))),
		SUM(measure),
		MIN(measure),
		MAX(measure),
		COUNTA(measure),
		COUNT(measure),
		AVERAGE(measure)
		)
The first option is TEXTJOIN(…etc. This function is then applied to measure and the result becomes the value for row r and column c in the output array of GROUPAGGREGATE.
The beauty of MAKEARRAY is that it will repeat the process above for each value of r and c. So, we will use control to apply the correct method – group the column, or aggregate the column – to a filtered list of data from the main data table.
The result of all this is we create a summary table with one simple formula. And the nice thing is, we can easily just change the control array and watch as the summary table updates dynamically:
There may be a better way to do what I’ve done here. If there is, I want to hear about it! Regardless, this was a very useful learning exercise. I hope you’ve found this interesting and if you end up using either RECURSIVEFILTER or GROUPAGGREGATE, then all the better.
Microsoft Excel Recalc Or Die says:
Ok,… another post to process… mind-blown! 🤯
me says:
This one was tough to write! I want to extend it to allow multiple aggregation methods per column.
Sam says:
Owen – your method is better than the one I used is the past. I just love the way you are able to specify the aggregations. My only suggestion is to include an optional header row parameter
My version does SUM by default.
GROUPBY = LAMBDA(tbl,rowCols,ValCols,[headers],
LET(
vTbl, IF(OR(ISOMITTED(headers),1),DROP(tbl,1),tbl),
vRowColsN, rowCols,
vTblH, INDEX(tbl,1,HSTACK(vRowColsN,ValCols)),
vRowCols, CHOOSECOLS(D,vRowColsN),
vRowColsC, BYROW(vRowCols,LAMBDA(r,TEXTJOIN(“|”,,r))),
vRowArea, UNIQUE(vRowCols),
vRowAreaC, BYROW(UNIQUE(vRowCols),LAMBDA(r,TEXTJOIN(“|”,,r))),
vCols, ValCols,
vFirstCol, TAKE(vCols,,1),
vRestCols, DROP(vCols,,1),
vInitialStack, BYROW(vRowAreaC,LAMBDA(r,SUMPRODUCT(CHOOSECOLS(D,vFirstCol),–(vRowColsC=r)))),
vCombineStacks, REDUCE(vInitialStack,vRestCols,LAMBDA(acc,curr,
HSTACK(acc,BYROW(vRowAreaC,LAMBDA(r,SUMPRODUCT(–CHOOSECOLS(D,curr),–(vRowColsC=r)))))
)),
vPivottbl, SORT(HSTACK(vRowArea,vCombineStacks)),
vResult, IF(OR(ISOMITTED(headers),headers),VSTACK(vTblH,vPivottbl)),
vResult
)
);
OP says:
Great suggestion. I was working on an alternative for this called PIVOT, but progress got waylaid and then Python in Excel showed up! I’ll hopefully get back to it soon.
sam says:
Take 2 : The earlier version had a hard coded reference my bad
GROUPBY = LAMBDA(tbl,rowCols,ValCols,[headers],
LET(
vTbl, IF(OR(ISOMITTED(headers),1),DROP(tbl,1),tbl),
vRowColsN, rowCols,
vTblH, INDEX(tbl,1,HSTACK(vRowColsN,ValCols)),
vRowCols, CHOOSECOLS(vTbl,vRowColsN),
vRowColsC, BYROW(vRowCols,LAMBDA(r,TEXTJOIN(“|”,,r))),
vRowArea, UNIQUE(vRowCols),
vRowAreaC, BYROW(UNIQUE(vRowCols),LAMBDA(r,TEXTJOIN(“|”,,r))),
vCols, ValCols,
vFirstCol, TAKE(vCols,,1),
vRestCols, IF(COUNTA(vCols) = 1, 1,DROP(vCols,,1)),
vInitialStack, BYROW(vRowAreaC,LAMBDA(r,SUMPRODUCT(CHOOSECOLS(vTbl,vFirstCol),–(vRowColsC=r)))),
vCombineStacks, IF(COUNTA(vCols)=1, vInitialStack,REDUCE(vInitialStack,vRestCols,LAMBDA(acc,curr,
HSTACK(acc,BYROW(vRowAreaC,LAMBDA(r,SUMPRODUCT(–CHOOSECOLS(Vtbl,curr),–(vRowColsC=r)))))
))),
vPivottbl, SORT(HSTACK(vRowArea,vCombineStacks)),
vResult, IF(OR(ISOMITTED(headers),headers),VSTACK(vTblH,vPivottbl),vPivottbl),
vResult
)
);
OP says:
Works like a charm! I replied to your other message with a non-thunk solution if it’s of interest. Cheers 👍
OP says:
Great! 👍