The lambda described in this post has been updated with additional features. You can read that post here.
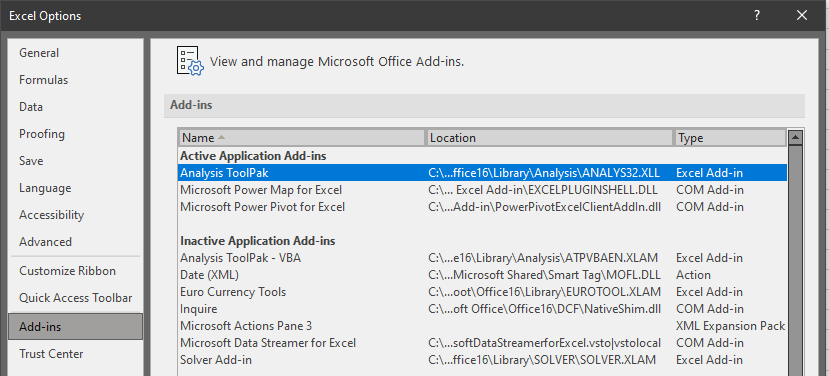
You can use the Data Analysis Toolpak to get descriptive statistics in Excel for a variable in your data. First, you need to make sure the analysis toolpak is activated as an Add-in:
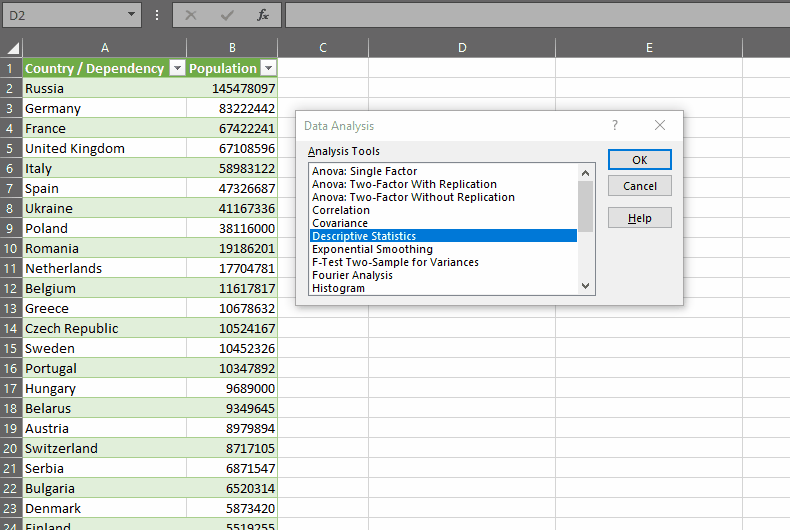
Then you select “Data Analysis” from the Data tab on the Ribbon, and do this:
These statistics can be useful in situations where you’re looking at your data for the first time and want to get a general feel for its shape and characteristics.
To shortcut this exercise, I wrote a LAMBDA that will output the statistics in the same format without using the add-in. I call this DESCRIBE.
=LAMBDA(dat_rng,has_header,
		LET(
			rng,IF(has_header,INDEX(dat_rng,2,1):INDEX(dat_rng,COUNTA(dat_rng),1),dat_rng),
			mean,AVERAGE(rng),
			med,MEDIAN(rng),
			stdev,STDEV.S(rng),
			cnt,COUNT(rng),
			stderr,stdev/SQRT(cnt),
			mode,MODE.SNGL(rng),
			svar,VAR.S(rng),
			kurt,KURT(rng),
			skew,SKEW(rng),
			maxm,MAX(rng),
			minm,MIN(rng),
			rang,maxm-minm,
			ssum,SUM(rng),
			conf,CONFIDENCE.T(0.05,stdev,cnt),
			MAKEARRAY(14+1,2,LAMBDA(r,c,
									IF(c=1,CHOOSE(r,
												"Statistic",
												"Mean",
												"Standard Error",
												"Median",
												"Mode",
												"Standard Deviation",
												"Sample Variance",
												"Kurtosis",
												"Skewness",
												"Range",
												"Minimum",
												"Maximum",
												"Sum",
												"Count",
												"Confidence Level(95.0%)"),
										CHOOSE(r,
											IF(has_header,INDEX(dat_rng,1,1),"Data Column "&c-1),
											mean,
											stderr,
											med,
											mode,
											stdev,
											svar,
											kurt,
											skew,
											rang,
											minm,
											maxm,
											ssum,
											cnt,
											conf)
										)
										)
										)
										)
										)
It’s long but I hope not that complicated. Here’s how it works:
DESCRIBE takes two parameters:
- dat_rng – the range of data you want to calculate descriptive statistics for. At time of writing, this should be a one-column array of numbers with an optional header row.
- has_header – TRUE if the range you’ve selected has a header row, FALSE otherwise
First, we calculate a variable rng, which is either rows 2 to the end of the selected range if there’s a header row, or it’s the entire selected range if there isn’t a header row.
We then calculate each of the required statistics separately, using native Excel functions. Here I’ve tried to do them in an order so that if a result for one calculation is needed in another, it can be reused (as with rang=maxm-minm).
Finally, we are using MAKEARRAY to construct the output. The number of rows is (number of descriptive statistics)+1 for the header, and 2 columns – one for the name of the statistic and one for the return value.
The LAMBDA going in to MAKEARRAY is pretty simple, we’re just using CHOOSE in both columns 1 and 2 to either place the name of the statistic, or the return value, in the output.
It’s that simple.
And of course, if you wanted to extend this to add statistics that are important to your work, or remove statistics from the list that aren’t, you could always modify the lambda accordingly.
Say if I wanted to add the third quartile of the data to the output, I would just add a definition of qthree, change the number of rows for MAKEARRAY, then add the new statistic name and output value to each of the CHOOSE statements. See lines 18, 19, 36 and 53 below.
=LAMBDA(dat_rng,has_header,
		LET(
			rng,IF(has_header,INDEX(dat_rng,2,1):INDEX(dat_rng,COUNTA(dat_rng),1),dat_rng),
			mean,AVERAGE(rng),
			med,MEDIAN(rng),
			stdev,STDEV.S(rng),
			cnt,COUNT(rng),
			stderr,stdev/SQRT(cnt),
			mode,MODE.SNGL(rng),
			svar,VAR.S(rng),
			kurt,KURT(rng),
			skew,SKEW(rng),
			maxm,MAX(rng),
			minm,MIN(rng),
			rang,maxm-minm,
			ssum,SUM(rng),
			conf,CONFIDENCE.T(0.05,stdev,cnt),
			qthree,QUARTILE.EXC(rng,3),
			MAKEARRAY(15+1,2,LAMBDA(r,c,
									IF(c=1,CHOOSE(r,
												"Statistic",
												"Mean",
												"Standard Error",
												"Median",
												"Mode",
												"Standard Deviation",
												"Sample Variance",
												"Kurtosis",
												"Skewness",
												"Range",
												"Minimum",
												"Maximum",
												"Sum",
												"Count",
												"Confidence Level(95.0%)",
												"3rd Quartile"),
										CHOOSE(r,
											IF(has_header,INDEX(dat_rng,1,1),"Data Column "&c-1),
											mean,
											stderr,
											med,
											mode,
											stdev,
											svar,
											kurt,
											skew,
											rang,
											minm,
											maxm,
											ssum,
											cnt,
											conf,
											qthree)
										)
										)
										)
										)
										)
And that’s that. I hope you find this useful or perhaps that it sparks an idea for how you can streamline your work.
Leave a Reply