Quick start
If you want to use this function to get descriptive statistics in Excel with just one formula and without reading all the detail below, you will need to:
- create a LAMBDA function called RECURSIVEFILTER using this gist
- create a LAMBDA function called GROUPAGGREGATE using this gist
- create a LAMBDA function called DESCRIBE using this gist
The DESCRIBE LAMBDA function
- Re-orders the statistics to place most commonly used statistics at the top of the output (Sum, Mean, Count)
- Describe multiple columns at once – lambda produces a tight array with row headers as the name of the statistic and columns headers that match the selected range
- “Distinct count” statistic for both numeric and text columns
- “Rows” statistic for both numeric and text columns. Note that this is not necessarily the same as “Count” since that uses the COUNT function, which ignores non-numbers
- Display #N/A for statistics meant for text columns as outlined below
- Describe text columns with
- “Minimum” i.e. the first unique value when sorted alphabetically. This is the same as the column profiling behavior in PowerQuery
- “Maximum” i.e. the last unique value when sorted alphabetically. This is the same as the column profiling behavior in PowerQuery.
- “Length of shortest text”
- “Length of longest text”
- “Most common text” – displays the text followed by the count of that text in parentheses
- “Least common text” – displays the text followed by the count of that text in parentheses
- Display #N/A for statistics meant for numeric columns (e.g. SUM of text is meaningless)
In order to use this LAMBDA, you must also have these:
- GROUPAGGREGATE – provides dynamic aggregation of arrays including “GROUP BY” functionality similar to SQL, which in turn requires
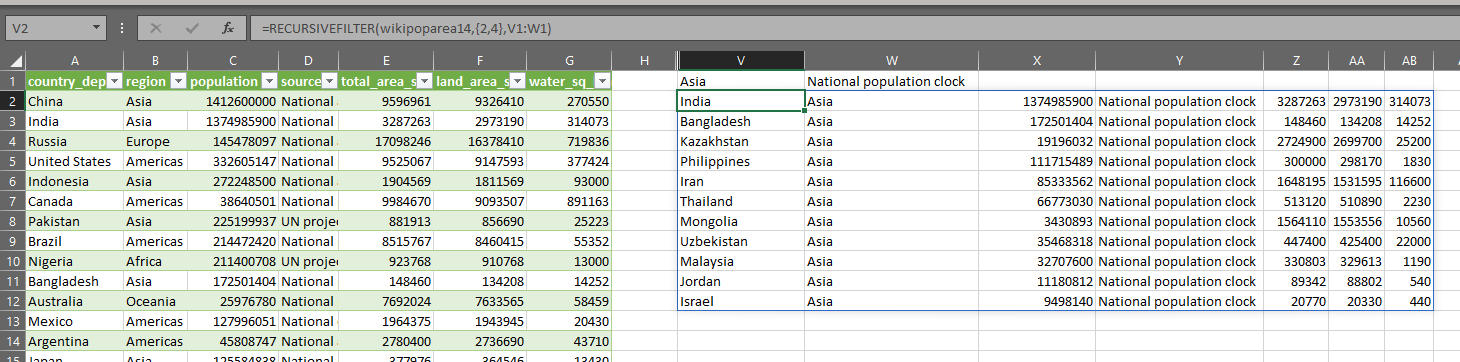
- RECURSIVEFILTER – a simplified way of passing multiple filter criteria into Excel’s native FILTER function
=LAMBDA(data,has_header,
	LET(
		rng,IF(
				has_header,
				INDEX(data,2,1):INDEX(data,ROWS(data),COLUMNS(data)),
				data
			),
		_header,
			IF(
				has_header,
				INDEX(data,1,1):INDEX(data,1,COLUMNS(data)),
				"Column "&SEQUENCE(1,COLUMNS(data))
			),
		_stats,{"Statistic";
				"Sum";
				"Mean";
				"Count";
				"Mode";
				"Standard Deviation";
				"Sample Variance";
				"Standard Error";
				"Kurtosis";
				"Skewness";
				"Confidence Level(95.0%)";
				"1st quartile";
				"Median";
				"3rd quartile";
				"Range";
				"Distinct count";
				"Rows";
				"Minimum";
				"Maximum";
				"Length of longest text";
				"Length of shortest text";
				"Most common text";
				"Least common text"},
		MAKEARRAY(
			COUNTA(_stats),
			COLUMNS(rng)+1,
			LAMBDA(r,c,
				IFS(
					c=1,
					INDEX(_stats,r,1),
					r=1,
					INDEX(_header,1,c-1),
					TRUE,
					LET(
						_m,INDEX(rng,,c-1),
						_istxt,ISTEXT(_m),
						_hastxt,OR(_istxt),
						_cnt,COUNT(_m),
						_alltxt,SUM(N(_istxt))=ROWS(_m),
						_mean,AVERAGE(_m),
						_median,MEDIAN(_m),
						_stddev,STDEV.S(_m),
						_stderr,_stddev/SQRT(_cnt),
						_mode,MODE.SNGL(_m),
						_var_s,VAR.S(_m),
						_kurt,KURT(_m),
						_skew,SKEW(_m),
						_max,MAX(_m),
						_min,MIN(_m),
						_range,_max-_min,
						_sum,SUM(_m),
						_conf,CONFIDENCE.T(0.05,_stddev,_cnt),
						_q_one,QUARTILE.EXC(_m,1),
						_q_three,QUARTILE.EXC(_m,3),
						_rows,ROWS(_m),
						_txtm,FILTER(_m,_istxt),
						_tfreqs,IF(_alltxt,GROUPAGGREGATE(CHOOSE({1,2},_txtm,_txtm),{"group","counta"}),#N/A),
						_tvals,INDEX(_tfreqs,,1),
						_tcounts,INDEX(_tfreqs,,2),
						_dcount,COUNTA(UNIQUE(_m)),
						_long,IF(_hastxt,MAX(LEN(_txtm)),#N/A),
						_short,IF(_hastxt,MIN(LEN(_txtm)),#N/A),
						_mosttxt,TEXTJOIN(",",TRUE,INDEX(_tvals,XMATCH(MAX(_tcounts),_tcounts),1))&" ("&MAX(_tcounts)&")",
						_leasttxt,TEXTJOIN(",",TRUE,INDEX(_tvals,XMATCH(MIN(_tcounts),_tcounts),1))&" ("&MIN(_tcounts)&")",
						_mintxt,INDEX(SORT(_tvals),1),
						_maxtxt,INDEX(SORT(_tvals,,-1),1),
						IF(AND(_alltxt,r<16),#N/A,
							CHOOSE(
								r-1,
								_sum,
								_mean,
								_cnt,
								_mode,
								_stddev,
								_var_s,
								_stderr,
								_kurt,
								_skew,
								_conf,
								_q_one,
								_median,
								_q_three,
								_range,
								_dcount,
								_rows,
								IF(_alltxt,_mintxt,_min),
								IF(_alltxt,_maxtxt,_max),
								_long,
								_short,
								_mosttxt,
								_leasttxt
							)
						)
					)
				)
			)
		)
	)
)
DESCRIBE takes two parameters:
- data – the range of data you want to calculate descriptive statistics for
- has_header – TRUE if the range you’ve selected has a header row, FALSE otherwise
First, we calculate a variable rng, which is either rows 2 to the last row of the selected range if there’s a header row, or it’s the entire selected range if there isn’t a header row.
Next, we define a variable called _header. If has_header=TRUE, then this is the first row of data. If has_header=FALSE, then we use ColumnN for each column where N is the position of the column in data.
Now we define a single-column array of the names of the statistics we’re going to calculate, called _stats.
Finally, we make an array that is the same number of rows as _stats and the same number of columns as data plus one for the column holding the names of the statistics.
The LAMBDA populating the new array uses r to identify a row and c to identify a column.
If the column c is the first column, we will place the name from the _stats variable on the r-th row.
If the row r is the first row, we will place the value from the _header variable in the c-th column.
Otherwise, we use LET to define a series of variables to calculate the various statistics. I won’t go into the detail of every calculation here, except to maybe draw your attention to the use of GROUPAGGREGATE, which when taken in isolation in this form, will calculate a frequency table of the text column passed into the CHOOSE function. This is not possible with Excel’s native FREQUENCY function.
This call to GROUPAGGREGATE is what allows DESCRIBE to get the most common text and least common text along with their respective frequencies.
The definition of these calculation variables continues through to _maxtxt.
At the end of the LET function, the value output to the cell is defined by the CHOOSE function. As you can see, for those measures (columns) which are all text, if the output row r is less than 16, the cell will return #N/A. Otherewise, the value in the cell will be the result of each of the respective calculations.
In summary
So that’s how you get descriptive statistics in Excel with just one formula.
This has been really interesting for me personally to figure out how to do this. If you decide to use it, I hope it’s useful.
I openly acknowledge that it will be somewhat slow on very large datasets, so please bear that in mind. That said, I don’t think it’s much slower than the Analysis Toolpak add-in.
With regards to next steps for this function: I want to combine DESCRIBE with GROUPAGGREGATE so that we can, in the example above, calculate statistics within each country and region as well as across each of the columns.
Do you have any ideas or requests for how to improve or add to DESCRIBE? Let me know!
Leave a Reply